In this homework, we will implement the Universal Portfolio algorithm by Cover.
[1] Cover, Thomas M. "Universal Portfolios." Mathematical Finance 1.1 (1991): 1-29.
[2] Blum, Avrim, and Adam Kalai. "Universal portfolios with and without transaction costs." Machine Learning 35.3 (1999): 193-205.
[3] Kalai, Adam, and Santosh Vempala. "Efficient algorithms for universal portfolios." Journal of Machine Learning Research 3.Nov (2002): 423-440.
[4] Cover, Thomas M., and Joy A. Thomas. Elements of information theory. John Wiley & Sons, 2012.
Let $m$ be the number of stocks of our interest. Recall that a probability induced portfolio gives us a "fund of funds" strategy, which is a mixture of all extremal strategies. More precisely, let $\mathrm{a}=\mathrm{a}_p$ be the portfolio induced by a pmf $p$. Then, $$ \mathrm{a}_{ij}(\mathrm{\mathbf{x}}^{i-1}) =\frac{ \displaystyle\sum_{y^{i-1}}p(j|y^{i-1})\mathrm{\mathbf{x}}(y^{i-1})p(y^{i-1}) }{ \displaystyle\sum_{y^{i-1}}p(y^{i-1})\mathrm{\mathbf{x}}(y^{i-1}) }. $$ A constant rebalanced portfolio (CRP) with $\theta=(\theta_1,\ldots,\theta_m)\in\Delta^{m-1}$ is induced by an iid probability $p_{\theta}(y^n)=\prod_{i=1}^n p_{\theta}(y_i)$, where $p_{\theta}(y)=\theta_y$ for $y\in[m]$.
To compete with the class of CRPs, let's consider a mixture strategy. For a density $w(\theta)$ of $\theta$ over the simplex $\Delta^{m-1}$, we consider $$ q_w(y^n)=\int_{\Delta^{m-1}} p_{\theta}(y^n)w(\theta)d\theta. $$ Then, we have $$ \mathrm{b}_{ij}(\mathrm{\mathbf{x}}^{i-1}) =\frac{ \displaystyle\int \theta_j \mathbf{S}_{i-1}(\theta,\mathbf{x}^{i-1})w(\theta)d\theta }{ \displaystyle\int \mathbf{S}_{i-1}(\theta,\mathbf{x}^{i-1})w(\theta)d\theta }, $$ and further $$ \mathbf{S}_n(\mathrm{b},\mathbf{x}^n)=\int \mathbf{S}_n(\theta,\mathbf{x}^n)w(\theta)d\theta. $$ In other words, this mixture strategy is equivalent to investing your money over the simplex continuously according to the weight $w(\theta)$. In particular, Cover's Universal Portfolio ($\mathsf{UP}$) algorithm is using $\mathsf{Dirichlet}(1/2,\ldots,1/2)$ prior for the density (or weight) $w(\theta)$. In general, let's call $\mathsf{UP}(\alpha)$ algorithm for the mixture startegy with $\mathsf{Dirichlet}(\alpha,\ldots,\alpha)$ prior.
Note that, however, the exact integration is computationally difficult. Hence, in this homework, we approximate the integration by Monte-Carlo sampling as follows. $$ \mathbf{S}_n(\mathrm{b},\mathbf{x}^n)\approx \frac{1}{N}\sum_{k=1}^N \mathbf{S}_n(\theta_k,\mathbf{x}^n). $$
import numpy as np
import pandas as pd # pandas data frame
import os # to access the file directories
import matplotlib.pyplot as plt
%matplotlib inline
%pylab inline
pylab.rcParams['figure.figsize'] = (15, 6)
font = {'family' : 'serif',
'weight' : 'normal',
'size' : 12}
matplotlib.rc('font', **font)
Populating the interactive namespace from numpy and matplotlib
In data/ folder, we provide a historical data over 10 years from Jan-01-17 to Dec-31-18 of 10 stocks having index of a single symbol. The data was collected at Yahoo! Finance (https://finance.yahoo.com/).
You are more than welcome to download any other stock you are interested in for this homework.
stock_name_dict = {'A': 'Agilent Technologies, Inc.',
'B': 'Barnes Group Inc.',
'C': 'Citigroup Inc.',
'D': 'Dominion Energy, Inc.',
'F': 'Ford Motor Company',
'M': 'Macy\'s, Inc.',
'S': 'Sprint Corporation',
'T': 'AT&T Inc.',
'X': 'United States Steel Corporation',
'Y': 'Alleghany Corporation'}
The following code preprocesses the historical data.
directory = 'data/'
stocks_dict = {}
prices_dict = {}
price_relatives_dict = {}
for filename in os.listdir(directory):
if filename.endswith(".csv"):
df = pd.read_csv(directory+filename)
stock_symbol = os.path.splitext(filename)[0]
temp_dict = {}
temp_dict['Name'] = stock_name_dict[stock_symbol]
temp_dict['Close'] = np.array(df['Close'])
temp_dict['Relative'] = np.array(df['Close']/df['Open'])
stocks_dict[stock_symbol] = temp_dict
else:
continue
for key in stocks_dict:
plt.plot(stocks_dict[key]['Close'], label=stocks_dict[key]['Name'])
plt.legend(loc=1)
plt.title(r'Stock prices');
plt.figure()
for key in stocks_dict:
plt.plot(stocks_dict[key]['Relative'], label=stocks_dict[key]['Name'])
plt.legend(loc=1)
plt.title(r'Price relatives');
prices_stack = np.vstack([stocks_dict[k]['Close'] for k in sorted(stocks_dict.keys())])
price_relatives_stack = np.vstack([stocks_dict[k]['Relative'] for k in sorted(stocks_dict.keys())])
In this problem, we find the optimal CRP in hindsight given the price relatives. Again, as the exact optimization is hard, we will perform a Monte Carlo search by sampling random points uniformly over the simplex. (It is okay to implement a grid search if you wish.)
Write a function
approx_optimal_CRP(price_relatives_stack, N)
which takes price_relatives_stack and N the number of random samples as inputs,
and outputs
Hint: The $\mathsf{Dirichlet}(1,\ldots,1)$ is the uniform distribution over the simplex, and np.random.dirichlet generates a Dirichlet random vector.
By the way, can you sample a point uniformly at random from the simplex without using the predifined Dirichlet sampling?
To generate a random probability vector $\vec{p}=(p_1,\ldots,p_d)$, we can follow the following simple procedure:
def invest_with_CRP(a_CRP, price_relatives_stack):
assert len(a_CRP) == len(price_relatives_stack)
return np.prod(np.dot(a_CRP, price_relatives_stack))
def approx_optimal_CRP(price_relatives_stack, N):
"""
Given price relative vectors, find an approximate optimal CRP
by Monte Carlo sampling of CRP over the simplex uniformly at random.
"""
num_stocks = price_relatives_stack.shape[0]
sampled_CRPs = [np.random.dirichlet([1]*num_stocks) for __ in range(N)] # uniformly sampled over the simplex
sampled_CRPs = sorted(sampled_CRPs, key=lambda x: x[0])
return_rate_list = [invest_with_CRP(CRP, price_relatives_stack) for CRP in sampled_CRPs]
approx_opt_CRP_idx = argmax(return_rate_list)
if return_rate_list[approx_opt_CRP_idx] > 1:
plt.plot([1-CRP[0] for CRP in sampled_CRPs], return_rate_list, marker="*")
return sampled_CRPs[approx_opt_CRP_idx], return_rate_list[approx_opt_CRP_idx]
In this problem, we implemet the approximate Universal Portfolio algorithm $\mathsf{UP}(\alpha)$.
Write a function
approx_UP(price_relatives_stack, N, alpha)
that takes
price_relatives_stack,alpha the parameter for the $\mathsf{Dirichlet}$ prior, andN the number of random samples drawn from the $\mathsf{Dirichlet}(\alpha,\ldots,\alpha)$ prioras inputs, and outputs
def approx_UP(price_relatives_stack, alpha=1/2, N=100):
"""
N: number of CRPs drawn from alpha
alpha: a parpameter for Dirichlet(alpha,...,alpha) prior
"""
num_stocks = price_relatives_stack.shape[0]
sampled_CRPs = [np.random.dirichlet([alpha]*num_stocks) for __ in range(N)]
return_rate_list = [invest_with_CRP(CRP, price_relatives_stack) for CRP in sampled_CRPs]
num_days = price_relatives_stack.shape[1]
b_UP = np.zeros(price_relatives_stack.shape)
for t in range(num_days):
return_rate_list_t = [invest_with_CRP(CRP, price_relatives_stack[:, :t]) for CRP in sampled_CRPs]
for k, CRP in enumerate(sampled_CRPs):
b_UP[:, t] += CRP * return_rate_list_t[k]
b_UP[:, t] /= sum(return_rate_list_t)
return np.mean(return_rate_list), b_UP
plt.plot(np.transpose(prices_stack[(0,1), :]))
[<matplotlib.lines.Line2D at 0x200d6a259e8>, <matplotlib.lines.Line2D at 0x200d6a25b38>]
%time approx_optimal_CRP(price_relatives_stack[(0,1,2), :], N=500000)
Wall time: 10.1 s
(array([7.93127792e-01, 2.06863282e-01, 8.92595149e-06]), 4.465356404129358)
%time approx_UP(price_relatives_stack[(0,1),:], N=1000, alpha=0.5)
Wall time: 30.7 s
(4.059432161074425,
array([[0.50271361, 0.50108446, 0.49933109, ..., 0.53650511, 0.53630791,
0.53634435],
[0.49728639, 0.49891554, 0.50066891, ..., 0.46349489, 0.46369209,
0.46365565]]))
b_UP = _[1]
b_UP
array([0.48279106, 0.48442079, 0.4861753 , ..., 0.44949084, 0.4496869 ,
0.44965067])
plt.plot(b_UP[0])
plt.plot(b_UP[1])
[<matplotlib.lines.Line2D at 0x200ca0e9e48>]
plt.plot(prices_stack[0])
plt.plot(prices_stack[1])
[<matplotlib.lines.Line2D at 0x200cba437b8>]
N=500
for i in range(len(stocks_dict)):
for j in range(i+1, len(stocks_dict)):
stock_indices = (i,j)
return_UP = approx_UP(price_relatives_stack[stock_indices,:], N=N, alpha=0.5)
plt.subplot(1,2,1)
__, return_optimal_CRP = approx_optimal_CRP(price_relatives_stack[stock_indices, :], N=N)
if return_optimal_CRP > 1:
print(stock_indices, return_UP, return_optimal_CRP)
plt.subplot(1,2,2)
plt.plot(np.transpose(prices_stack[stock_indices, :]))
plt.title(stock_indices)
plt.figure()
(0, 1) 4.0529095695587705 4.465675328712097 (0, 2) 1.0570894674563118 4.32899846003565 (0, 3) 3.3766002188855455 4.36916281063263 (0, 4) 1.0869808634386162 4.3596953458441865 (0, 5) 2.052217215118657 4.362765949188257 (0, 6) 1.0956870419114644 4.332083136607008 (0, 7) 2.124001272366331 4.368963532237619 (0, 8) 1.2853187498953944 4.263733846189493 (0, 9) 3.188312225382015 4.368820778481182 (1, 2) 0.7582146162913356 3.282675863032962 (1, 3) 2.998499012658981 3.3687708572977444 (1, 4) 0.6873832944481592 3.129789007187662 (1, 5) 1.7254527296203863 3.2875990170171514 (1, 6) 0.8441957084107145 3.2400563510259905 (1, 7) 1.8561290001879047 3.284332860347145 (1, 8) 1.0217392383068304 3.2848530077155713 (1, 9) 2.792817240760202 3.2966632014245616 (2, 3) 0.5151777580706158 2.3220220686358624
C:\Users\Jongha\Anaconda3\lib\site-packages\matplotlib\cbook\deprecation.py:106: MatplotlibDeprecationWarning: Adding an axes using the same arguments as a previous axes currently reuses the earlier instance. In a future version, a new instance will always be created and returned. Meanwhile, this warning can be suppressed, and the future behavior ensured, by passing a unique label to each axes instance. warnings.warn(message, mplDeprecation, stacklevel=1)
(2, 9) 0.4619838440570705 1.931117995948166 (3, 4) 0.5938321506559189 2.283464665598109 (3, 5) 1.3110442018280828 2.330834716222988 (3, 6)
C:\Users\Jongha\Anaconda3\lib\site-packages\matplotlib\pyplot.py:528: RuntimeWarning: More than 20 figures have been opened. Figures created through the pyplot interface (`matplotlib.pyplot.figure`) are retained until explicitly closed and may consume too much memory. (To control this warning, see the rcParam `figure.max_open_warning`). max_open_warning, RuntimeWarning)
0.6352772457794267 2.3239116834277325 (3, 7) 1.3868056905673263 2.330806020612513 (3, 8) 0.7186073775623206 2.3200884394147177 (3, 9) 2.2369220270717936 2.3977724870237305 (4, 9) 0.4536030409124963 1.9185672577702815 (5, 9) 1.2240939548688388 1.947617055623075 (6, 9) 0.5606042919228192 1.9117078032333024 (7, 9) 1.2462517708091545 1.9479921600219072 (8, 9) 0.624765123256832 1.9488397302975098
<matplotlib.figure.Figure at 0x1e50f3a89b0>
approx_UP(price_relatives_stack[0:4], N=100000, alpha=1/2)
1.4687807371527541
a_CRP = np.random.dirichlet([1/2]*price_relatives_stack.shape[0])
invest_by_CRP(a_CRP, price_relatives_stack)
--------------------------------------------------------------------------- NameError Traceback (most recent call last) <ipython-input-16-5f635d903491> in <module>() 1 a_CRP = np.random.dirichlet([1/2]*price_relatives_stack.shape[0]) ----> 2 invest_by_CRP(a_CRP, price_relatives_stack) NameError: name 'invest_by_CRP' is not defined
Now based on our the implementations, we would like to check the performance of the $\mathsf{UP}$ algorithm compared to the optimal CRP using the real market data.
As mentioned at the beginning, you can download additional data to perform the following experiments.
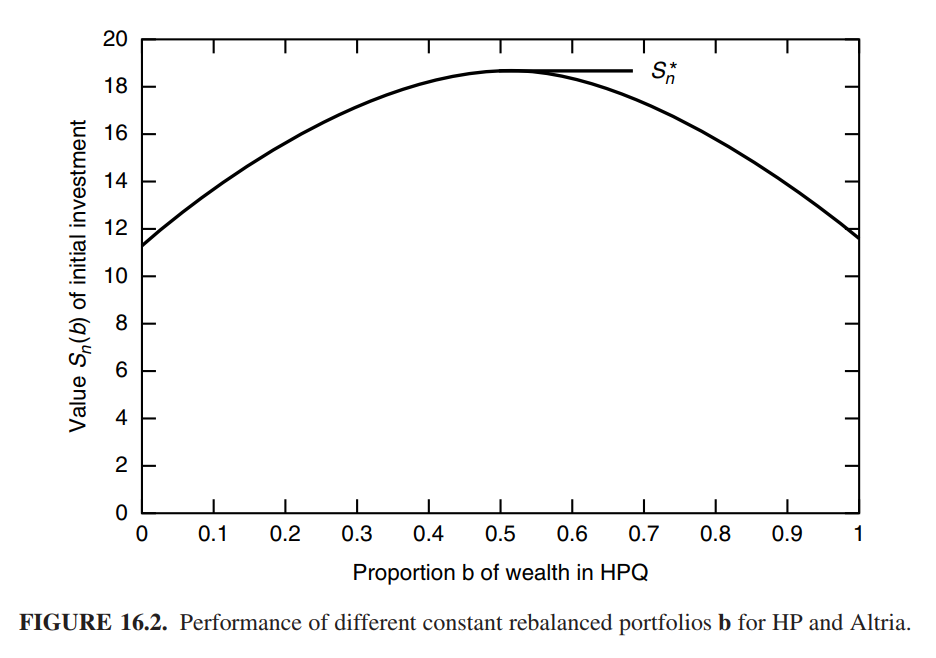
Choose any two stocks such that the performance of the CRP over the stocks looks as follows.
![]() |